World Bank Data
Scanning the list of indicators, we see the link to "GDP per capita, PPP...", and the text for the link gives the indicator code we are looking for, "NY.GDP.PCAP.PP.CD". Additionally we can note from the chart that the populated data starts in 1990. Following the link, we get the option to download the series as csv, xml, or xls, and can download a file (now named API_NY.GDP.PCAP.PP.CD_DS2_en_csv_v2_9908727.zip, but it could be something else another day) to use in a later blog.
Installing pandas_datareader
A pandas_datareader can be installed using conda:$ conda install -c anaconda pandas-datareader
Using pandas_datareader
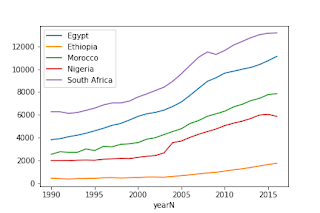
The following can be downloaded as a notebook. The chart created in the notebook can be seen below.
world bank data with pandas_datareader
Downloaded ppp data csv. Workaround neded for version incompatability in datareader. See discussion</a href>.
In [33]:
# imports
import os
import pandas as pd
pd.core.common.is_list_like = pd.api.types.is_list_like # workaround
from pandas_datareader import wb as WB

# CONST
indCode = "NY.GDP.PCAP.PP.CD" # code for  per capita ppp gdp
Downloading with pandas_datareader
Arguments are
- indicator= Code for series to grab
- country= "all" or list of 2 byte country codes. Defailt is to "CA MX US".split(). We should prefer to filter in Python rather than in the pull.
- start= Desired start year. Better to filter in Python so set early.
- stop= Desired stop year. Better to filter in Python so set late.
In [50]:
# grab all data for
pppDF = WB.download(indicator=indCode, country="all", start=1980, end=2020)
pppDF.head()
Out[50]:
Reshaping the data
- Removing rows with null entries.
- Reseting indexes because you never want indexes.
- Giving a normal whitespace free name to the series.
- Sorting just to make table display read better.
- Making numeric copy of the string year.
In [51]:
pppDF = pppDF.dropna().reset_index()
pppDF.columns = "country year GDPpc".split()
pppDF.sort_values("year country".split(), inplace=True)
pppDF["yearN"] = pppDF.year.apply(pd.to_numeric)
pppDF.head()
Out[51]:
Filtering for top African economies
The spelling of Egypt is a little unfortunate. Here we need exact matches.
In [52]:
# top Africa economies
aL = "Nigeria|South Africa|Egypt, Arab Rep.|Morocco|Ethiopia".split("|")
africaDF = pppDF[pppDF.country.isin(aL)]
africaDF.head()
Out[52]:
plotting
In [54]:
# the next line is needed to diaplay the plot in the notebook
%matplotlib inline
import matplotlib.pyplot as plt
fig, ax = plt.subplots()
africaDF.groupby("country").plot(x="yearN", y="GDPpc", ax=ax)
ax.legend("Egypt|Ethiopia|Morocco|Nigeria|South Africa".split("|"))
fig.savefig("africaGDPpc.png")
No comments:
Post a Comment